LogoforgoogleFlow-01.png

Google Flow App

Asthma-on-the-go


Client: Google

Project Timeline: Feb 2019- 2 weeks

Deliverables: App design

Team: Solo - with mentor guidance

Role: UX/UI Designer

Tools: Adobe Xd, Photoshop, Illustrator


The Challenge

Google (now Alphabet) has been recently investing more and more in the Healthcare space. They are improving Google search with specific healthcare cards and quick information for the user, as well as working harder on research and cloud initiatives.

The healthcare industry is also currently being revolutionized by wearable technologies. Over 65% of the wearables today are wrist-based devices shaped like watches, but there are also other wearables for the arms, torso, and waist. Aesthetics and data are driving factors in wearables, but also durability and weatherproofing are key. Armed with wireless connection and long-duration batteries, wearables can be read by a mobile app or a website in real time.

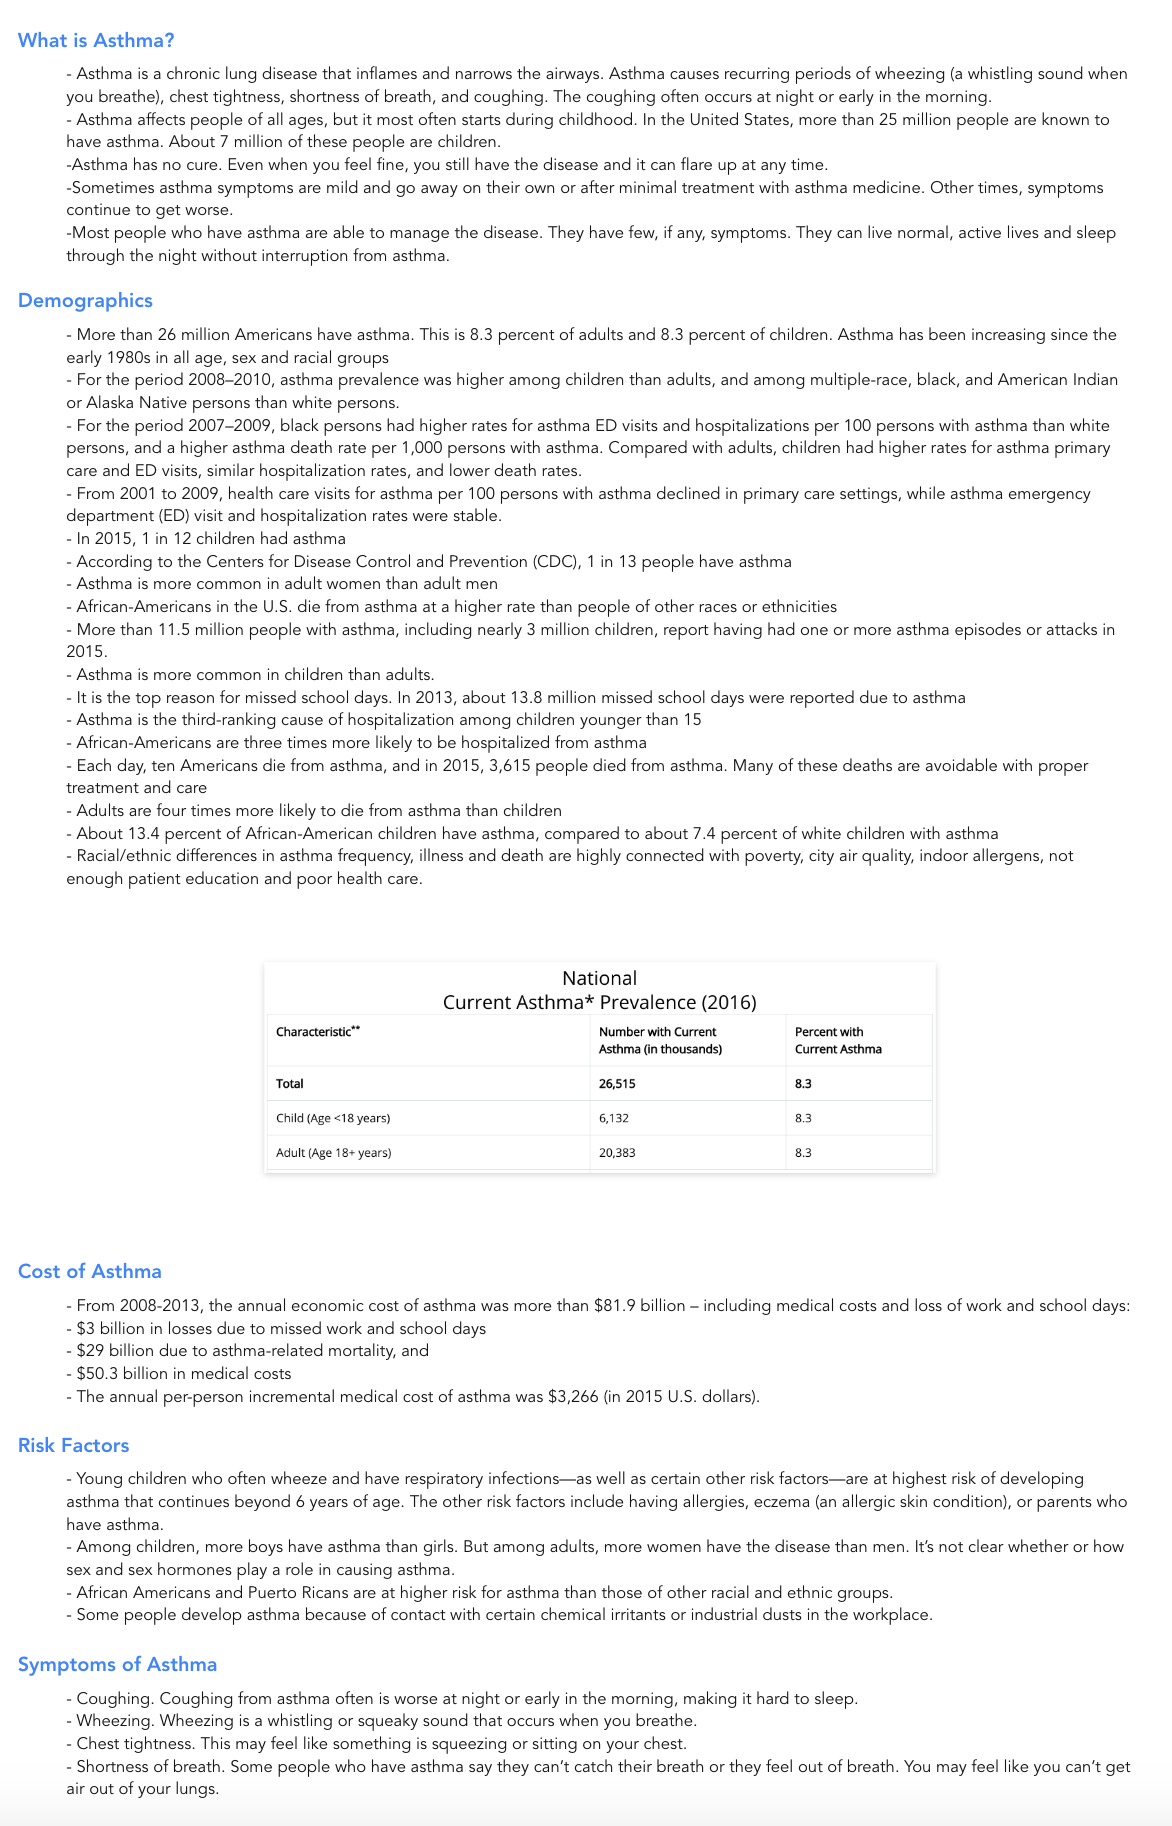
According to the Centers for Disease Control and Prevention, asthma currently affects over 25 million adults and children in the U.S. alone, and is responsible for 14.2 million physician visits each year and 1.8 million emergency care visits. Asthma is a chronic disease that makes breathing difficult. An inflammation of the air passages results in a temporary narrowing of the airways that carry oxygen to the lungs. This results in asthma symptoms, including coughing, wheezing, shortness of breath, and chest tightness. Asthma can be aggravated by weather, pollution, and many other triggers.

Google Flow’s greatest value to the market comes via wearable technology that allows users to track their vitals and other signs that could contribute to asthma at anytime. This wearable comes in the shape of a necklace that, for more accuracy, can also be worn as a chest patch. The battery is the same as that of a watch, so it only needs to be changed around once per year.

Google Flow is a combination of a wearable patch and mobile app that helps people monitor and manage their asthma. Google has been investing more and more in healthcare recently and they have contacted you to help them with this brand new application. The app will be developed first for Android, adhering to Material Design and Google’s guidelines. In addition to the Android app, it’ll also be nice to develop a web version (desktop) for a quick overview and a companion smartwatch app (Android) for notifications.


The Objective

  • Design an Android mobile app that helps users monitor and manage their asthma. The app should be in line with Material Design and other Google apps (check common patterns and styles for coherence and consistency)

  • Design a logo for Google Flow that is also in line with the Google family


P r o c e s s

Screen+Shot+2018-12-19+at+2.10.16+AM (1).png

1. R e s e a r c h

Goals: To research about asthma and asthma managing apps on the market

Process: Market Research / Competitive Analysis / Contextual inquiry

Research Goals

  • Identify and analyze similar organizations and competitors

  • Understand people’s asthma experience (pain points, frustrations, goals)

  • Discover how people manage/cope with their asthma symptoms

Assumptions

  • Kids under the age of 13 and adults of the ages 50+ will most likely have asthma due to weakened immune system

  • People with family members already having asthma will more likely to get asthma over the years than those who don’t

  • People living in most city/industrial area will likely to have asthma

  • People with asthma will likely own several devices and apps to help them cope with asthma attacks depending on severity

Research Questions

  • Demographics of people with asthma symptoms

  • How people are currently managing with their asthma attacks?

  • What are out in the market to reduce the asthma attack frequency or symptoms?

  • What kind of devices/apps are out in the market to help manage asthma attacks?

  • What factors influence people’s asthmas symptoms?Methodologies

Methodologies

  • Market Research [Secondary Research]: To learn about the current demographics of people with asthma and their ways to manage and cope with asthma symptoms

  • Competitive Analysis [Secondary Research]: Analyze the direct competitors and potential competitors.

  • Contextual Inquiry [Primary Research]: Interview people with asthma and or people who lives/interact with people with asthma

  • Survey [Primary research]: Survey large pool of people of people with asthma or who lives/interact with people with asthma (as a second option for primary research)


Market Research

To understand more about what this condition called ‘Asthma’ is and it’s demographics, I used market research to dig deeper into finding trends and patterns regarding patients who were diagnosed with Asthma. I tried to answer as many research questions (prior to starting the market research) while doing market research.

Screen Shot 2019-02-13 at 10.17.03 AM.png
Screen Shot 2019-02-13 at 10.17.12 AM.png
 

Competitive Analysis

With my market research I was able to find 4 asthma managing apps that are on the market right now. Each apps had their own strengths and weaknesses; which are all documented on the competitive analysis shown below.


Contextual Inquiry

To gather insight on the target user of Google Flow, I interviewed total of 3 participants. All females over the age of 18.

In order to look for participants that had asthma, first looked at Designlab’s slack channel under survey/test section. I was able to interview one person from slack channel and two people through a friend’s help.

Interviews were all performed on one day where they were asked series of questions regarding when they first got diagnosed, how they manage, and their frustrations regarding living with asthma.

 
  • Age: 24 - 35

  • Gender: 3 Females

  • Location: All city region

  • History of Asthma: 1 yes, 2 N/A


Assumptions

  • Kids under the age of 13 and adults of the ages 50+ will most likely have asthma due to weakened immune system

  • 3/3 participants got diagnosed with asthma under the age of 13.

  • People with family members already having asthma will more likely to get asthma over the years than those who don’t

  • 1/3 participants said had family members with asthma

  • People living in most city/industrial area will likely to have asthma

  • 2/3 participants grew up in city area

  • People with asthma will likely own several devices and apps to help them cope with asthma attacks depending on severity

  • 0/3 participants used apps; 3/3 participants all used 1 or more inhalers


2. D e f i n e

Goals: To define Google Flow’s target users and understand their needs, goals, and frustrations

Process: Empathy Map / Persona / POV Statements + HMW Questions


Empathy Map

I organized all the data points collected from the interviews into an empathy map. Each data point is categorized into sub categories such as - feel, does, think, see, pain, gains, and hear. I then rearranged them into common groups where insights and target user’s needs are deduced.

Insights

  • Users all use some sort of peak flow meter to measure their breath strength

  • Users have different triggers that may aggravate asthma symptoms

  • Users often forget to take daily medication

  • Users often forget to carry inhalers

  • Users still experience mild asthma symptoms from time to time

Needs

  • Users need a way to record their peak flow meter measurements

  • Users need a way to know what aggravate their asthma symptoms

  • Users need a reminder to take their daily medication

  • Users need a reminder to carry their inhalers

  • Users need a way to be prepared for emergency asthma attack


Persona

Next, I created “Dolly the Dragon boater” persona to help represent the needs synthesized from empathy map. Her persona allowed me to empathize with the end user throughout the whole design process.

Goals, motivations and frustrations were also inferred from empathy map.


POV STATEMENTS AND HMW QUESTIONS

Next, with Dolly'’s needs synthesized from empathy map, POV statements and HMW questions were made to make Dolly’s needs actionable tasks. HMW questions lead to open up some brainstorm ideas that could help solve some design challenges regarding main features of Google Flow

Screen Shot 2019-02-13 at 10.33.36 AM.png
 

3. I D E A T E

Goals: To ideate features, information architecture, and flows.

Process: Product Roadmap / Sitemap / Task Flow / User Flow

Product Roadmap

Once common goals have been identified (overlapping of business and users goals), I prioritized them along with some key features that might potentially get incorporated into app design.

Screen Shot 2019-02-13 at 10.35.23 AM.png


Site Map

Next, I created a site map to visualize how the site will be organized. Since it is a mobile app, point of entry will always be accessed through either the app or the wearables. (wearables only have limited features you can access the information from)

Screen Shot 2019-02-13 at 10.36.05 AM.png


User Flows

User flow was created to show couple different entry point and different users could take navigating through the app. The entry points were common methods that current market users are taking.


Task Flows

Task flow was also created to analyze the steps users take to complete a certain task. The task for this particular scenario was for users to open the app, login and create profile (for first time users) and enter data for the day to log their asthma symptoms.


4. D e s i g n

Goals: To design responsive Mid fidelity wireframes

Process: Sketches / Mid-fidelity wireframes


Sketches

I started drawing out very rough sketches (low-fidelity wireframes) but adding just enough details to show the main structure of the app. Sketches were very rough and low-fidelity but annotated with important keywords to show stakeholders what each page is about.

Screen Shot 2019-02-13 at 10.46.32 AM.png
Screen Shot 2019-02-13 at 10.46.40 AM.png


Mid Fidelity Wireframes

Once low fidelity sketches were complete, I moved onto mid-fidelity wireframes using Adobe Xd. Designs were changed from low fidelity to mid fidelity while studying more on google’s material design guidelines.

View Wireframes: HERE


5. P r o t o t y p e

Goals: To prototype Mid-fidelity wireframes and use it for testing to gain feedbacks.

Process: Prototype / Usability Testing


Prototype

To use it for usability testing, I went ahead and used Adobe Xd to prototype the high fidelity wireframes from before.

Feel free to view the prototype below.

View prototype: HERE


Usability Testing

Tasks

Scenario: You were diagnosed Asthma as a kid. Severity of your symptoms tend to fluctuate from temperature/location/time and you want to document anytime you experience asthma symptoms to help you manage.

Task 1) Register and enter your first data entry for the day.

Task 2) Log a trigger notified from Alert tab

Objectives

  1. Find areas to improve

  2. Increase usability with feedbacks from participants

  3. Gain insight on how users interact with the app

Results:

I was able to find 3 participants (2 males and 1 female) to do usability testing with. Due to snowstorm (a.k.a snowmageddon 2019) in Seattle, roads were impossible to navigate on, stores were closed, events were canceled, and accidents everywhere where it inhibited me from going out to find more usability testing participants.

Regardless! the results and feedbacks I got from 3 usability participants showed enough patterns for me to move onto affinity map.


6. I t e r a t e

Goals: To iterate design using feedbacks gathered from testing to High-fidelity wireframes

Process: Affinity Map / Logo + Style tile / UI Kit / High-Fidelity Wireframes

Affinity Map

I created an affinity map to synthesize findings gathered from usability testing. Patterns (based on what I observed while testing) and comments (what users have verbally said) were noted as well as success rates of tasks that were given to the participants. Insights have been inferred to prioritize recommendations that will be incorporated into final designs.

Screen Shot 2019-02-13 at 10.58.41 AM.png
Screen Shot 2019-02-13 at 10.58.48 AM.png


Logo + Style Tile

Created a logo and a basic style tile that is aligned with Google’s existing brand.


High Fidelity Wireframes

View prototype: HERE

Screen Shot 2019-02-13 at 11.04.11 AM.png
Screen Shot 2019-02-13 at 11.04.21 AM.png
Screen Shot 2019-02-13 at 11.05.18 AM.png
Screen Shot 2019-02-13 at 11.04.29 AM.png
Screen Shot 2019-02-13 at 11.04.36 AM.png
Screen Shot 2019-02-13 at 11.04.58 AM.png
Screen Shot 2019-02-13 at 11.04.45 AM.png
Screen Shot 2019-02-13 at 11.05.07 AM.png


UI Kit

UI Kit was used as a reference kit when creating Google Flow. Because Google is already an established brand, any new feature that gets implemented should not deviate from the brand’s guideline. I referenced back and forth to this UI kit for color palette, type font, button styles/colors and overall feel of UI to keep the brand feel more consistent.


REFLECTION.

Next Step

  • Continue working on high-fidelity wireframes + prototype

  • Gain usability on high-fidelity prototype (revised)

  • Design Wearable interface

Currently effecting over 25 million people, asthma is responsible for high hospital visitation rate. Although patients who were diagnosed as a child can live a normal life, there are times where unpredictable factors that may trigger symptoms. With this Google Flow, we’re hoping to help people manage their asthma symptoms and ultimately reduce the number of asthma attacks that may lead to hospital visits.

 
Untitled--01.png
Perspective App Screens Mock-Up.jpg

Meetup App

New Feature Design


Client: Meetup

Project Timeline: Jan 2019- 2 weeks

Deliverables: New Feature App Design

Team: Solo - with mentor guidance

Role: UX/UI Designer

Tools: Adobe Xd, Photoshop, Illustrator


The Challenge

The focus of this project is to help users discover events that are nearby that fit the users’ interest. With so many groups and events happening it is hard for users to discover almost all meetups. Some events and groups  go unnoticed by users just because it never notified to potential members. By incorporating intuitive design, I would like to solve this issue and help new groups to increase their visibility on the platform and overall increase discoverability.


The Objective

  • Design a feature that allows users to discover more groups nearby.

  • Design a feature that allows users to discover groups via friends.


P r o c e s s

Process.png

1. R e s e a r c h

Goals: To research current event hosting/event making platform’s market and its users

Process: Market Research / Competitive Analysis / Contextual inquiry

Research Goals

  • Understand how users discover new groups/events to join

  • Identify and analyze top competitors

  • Determine user’s needs

  • Identify user’s pain points

  • Identify user’s motivations

Assumptions

  • People will most likely only join groups that are nearby. (Close proximity)

  • People will most likely join that have same age groups .

  • People will most likely discover meetups via friends/coworkers.

  • People will more likely to join a group that their friends are in.

Research Questions

  1. What do people use Meetup For? Who are the main users?

  2. How do people find Meetup groups and/or events to join?

  3. What are some of the popular groups? — and why?

  4. What makes the Meetup app successful? Why is it unsuccessful?

Methodologies

  • Market Research [Secondary Research]: Understanding about the current trends on how people discover events/groups to join and or participate.

  • Competitive Analysis [Secondary Research]: Analyze the direct competitors and indirect competitors.

  • Contextual Inquiry [Primary Research]: Interview people who are currently using meetup and or have used meetup to participate in events.


Market Research

To understand the current state of Meetup and it’s users’ demographics, I used market research [ secondary research method ] to collect information. Also researched on other competitors, such as facebook events & Eventbrite, to understand how users are discovering events nearby.

Screen Shot 2019-01-28 at 8.58.15 AM.png
Screen Shot 2019-01-28 at 8.58.27 AM.png
 

Competitive Analysis

Based on my research I was able to find couple direct and indirect competitors. Direct competitor (indicated by a red star) is chosen because of the service it provides. Facebook event has similar services with Meetup in a sense that it allows users to “create a group”, “Create an event within the group”, “Create an event” where it makes it easy for users to do a reoccurring events. Whereas I found Do206 and Eventbrite is mostly for one time only events.


Contextual Inquiry

Meetup is an online service used to create groups that host local in-person events. As of 2017, there are about 35 million Meetup users. Each user can be a member of multiple groups or RSVP for any number of events. Users are usually using the website to find friends, share a hobby, or for professional networking. They are always looking for ways to improve on interactions between users and the app.

To gain insight, I interviewed 2 male and 1 female Meetup users. To make sure that the participants are indeed Meetup users, I went to a Meetup to join in on them in action. They were asked series of questions on how they got started on Meetup app, what their experiences were like on all the Meetup, as well as their processes on choosing an event and groups to join on Meetup.


  • Age 27-34

  • Gender: 1 female, 2 male

  • Frequent Meetup User (at least once a week)


Assumptions

  • People will most likely only join groups that are nearby. (Close proximity)

2/3 Participants agreed that they do consider proximity when determining event to join

  • People will most likely join that have same age groups .

1/3 Participant mentioned same age group when determining choosing an event to join.

  • People will most likely discover meetups via friends/coworkers.

1/3 Participant discovered meetup via friend/coworker. 2/3. Participants discovered via google search.

  • People will more likely to join a group that their friends are in.

3/3 Participants mentioned they join an event that their friends are in.


2. D e f i n e

Goals: To define Meetup App’s target users and understand their needs, goals, and frustrations

Process: Empathy Map / Persona / POV Statements + HMW Questions


Empathy Map

I organized all the data points collected from the interviews into an empathy map. Each data point is categorized into sub categories such as - feel, does, think, see, pain, gains, and hear. I then rearranged them into common groups where insights and target user’s needs are deduced.

Insights

  • Users use interest categories heavily in when searching for events to join in Meetup

  • Users join groups that are active (have had events recently)

  • Users will most likely join in on events that friends are also joining

  • Users use Meetup to increase circle of friends

Needs

  • Users need a better way to search groups in each categories.

  • Users need a way to see if the group is active or not

  • Users need a way to see which events friends are attending

  • Users need a better way to help connect with people in a same group


Persona

Next, I created “Cody the coder” persona to help represent the needs synthesized from empathy map. Goals and frustrations were also inferred from empathy map. This user persona allowed me to empathize with the end user throughout the whole design process.


POV STATEMENTS AND HMW QUESTIONS

Next, with Cody'’s needs synthesized from empathy map, POV statements and HMW questions were made to make Cody’s needs actionable tasks. HMW questions lead to open up some brainstorm ideas to a group that could help solve some design challenges regarding new features for Meetup.

Screen Shot 2019-01-28 at 9.12.33 AM.png
 

3. I D E A T E

Goals: To ideate features, information architecture, and flows.

Process: Product Roadmap / Sitemap / Task Flow / User Flow

Product Roadmap

Once common goals have been identified (overlapping of business and users goals), I prioritized them along with some key features that might potentially get incorporated into app design.

Screen Shot 2019-01-28 at 9.13.10 AM.png


Site Map

Next, I created a site map to visualize how the site will be organized. Please note that pages noted with a red star are new features.

Screen Shot 2019-01-23 at 4.12.38 AM.png


User Flows

User flow was created to show two common entry point. The entry points were common methods that current market’s users are taking.


Task Flows

Task flow was also created to analyze the steps users take to complete a certain task. The task for this particular scenario was for users to arrive at a main page in the app and find a potential event and or group to join


4. D e s i g n

Goals: To design responsive low and high-fidelity wireframes

Process: Sketches / High-Fidelity Wireframes


Sketches

I started drawing out very rough sketches (low-fidelity wireframes) but adding just enough details to convey the functionality of the new feature I am proposing. I tried t keep it very rough and minimum as possible since I am using this step to visualize what I’m working towards.


High Fidelity Wireframes

Once low fidelity sketches were complete, I moved onto high fidelity wireframes using Adobe Xd and Photoshop

View prototype: HERE


5. P r o t o t y p e

Goals: To prototype high-fidelity wireframes and use it for testing to gain feedbacks.

Process: Prototype / Usability Testing


Prototype

To use it for usability testing, I went ahead and used Adobe Xd to prototype the high fidelity wireframes from before.

Feel free to view the prototype below.

View prototype: HERE


Usability Testing

Tasks

  1. Search for a nearby (less than 5 miles in radius) Art Events using a map feature in explore screen

  2. Search for ‘UX meetup’ and request organizer to connect (add friend)

  3. Look for group that’s trending with you connections and also join in on the group + event.

Objectives

  1. Find areas to improve

  2. Increase usability with feedbacks from participants

  3. Gain insight on how users interact with the new features

Results:

I was able to find 4 participants by attending a Meetup. (2 individuals and 1 couple). The participants were active Meetup users who have been attending meetups at least once a week on average. Completion rates were 100% successful. . Predicted error-free rate was 90% but from testing I found out the error-free rate was actually lower than 90% due to the first task not being intuitive enough for users.


6. I t e r a t e

Goals: To iterate design using feedbacks gathered from testing to High-fidelity wireframes

Process: Affinity Map / High-Fidelity Wireframes (Revised) / UI Kit

Affinity Map

I created an affinity map to synthesize findings gathered from usability testing. Patterns (based on what I observed while testing) and comments (what users have verbally said) were noted as well as success rates of tasks that were given to the participants. Insights have been inferred to prioritize recommendations that will be incorporated into final designs (high fidelity wireframes revisions)

Screen Shot 2019-01-28 at 9.17.18 AM.png
 

High Fidelity Wireframes (Revised)

View prototype: HERE


UI Kit

UI Kit was used as a reference kit when building UI for Meetup. Because Meetup is already an established brand, any new feature that gets implemented should not deviate from the brand’s guideline. I referenced back and forth to this UI kit for color palette, type font, button styles/colors and overall feel of UI to keep the brand feel more consistent.


REFLECTION.

Next Step

  • Continue working on high-fidelity wireframes + prototype

  • Gain usability on high-fidelity prototype (revised)

  • Add goals from product roadmap that never got addressed

With this new feature I am proposing, I am hoping it will it will help other events and groups’ discoverability to increase as well as their member count. Meetup is moving into more rating and review systems where discoverability is crucial as far as increasing members go. I do not work for Meetup but I am a loyal user and love the service Meetup has provided me over the years.

 
2-01.png
Updatedicon.jpg

Mirror: E-commerce website

Role: UX Researcher, UX Designer, UI Designer.

Duration: 4 weeks

Client: Mirror Clothing Brand

Tools: Sketch App, Adobe Xd, Adobe Photoshop, Invision, Marvel App, Zeplin

Challenge: Established back in 1994, MIRROR is an affordable clothing store targeting wide range of age groups. With huge selection, with decent quality, and affordable prices Mirror has been a successful clothing company offline. With 400 stores around the world in 32 countries, Mirror kept their experience streamlined and well taken care of.

With online market increasing, the opportunity to explore in the field of digital has come to Mirror as well. With this Mirror e-commerce project, Mirror will rebrand and launch their new look via online in the near future.

Objectives:

  • Design intuitive and responsive e-commerce website.

  • Redesign logo and brand


Design Process

DesignProcess.png

1. Research

Goal: To research audience and the current market

Process: Secondary Research & Primary Research

Research goals

  • Identify and define target users.

  • Identify online shoppers’ pain points.

  • Determine what users’ main needs are.

  • What motivates the users to shop online.

  • Determine what the users’ expectations are regarding online clothing shop.

Research Methodologies

  1. Secondary Research

    • Market Research :Research on any trends, preferences, shopping habits of customers.

    • Competitive Analysis: Researching on E-commerce brands that are on the market currently and identify strengths and weakness of the competitors.

  2. Primary Research
    1:1 Interview: To empathize with user by obtaining information through series of questions regarding their experience with clothing stores in-store and online.

Competitive Analysis:

As part of secondary research, I Investigated various competitor’s weaknesses and strengths.

Screen Shot 2018-11-07 at 3.00.16 AM.png
Screen Shot 2018-11-07 at 3.01.22 AM.png

Contextual Inquiry

Overview:

I was able to interview 5 potential users. Users were asked about their experiences regarding purchasing clothing from in-store and online, what their normal processes are like, what their return processes are like, what was memorable, what they did like, and what they did not like; all regarding their clothes shopping experiences.

Participants:

  • 4 Female, 1 Male

  • Ages between 23 - 32

  • All have experiences buying clothes in-store and online


2.Define

Goals: To empathize and understand user’s needs, goals, and frustrations.

Process: Empathy map, User Persona, Storyboard

Empathy Map

Created an empathy map based on the interview. Each color indicates different users (total of 5 users) wrote down what they mentioned in the interview and categorized them into see, feel, think, do, pain, gain, etc. Once that was finished insights and needs were documented.

Insight:

  • Users are reluctant to purchase clothes online due to fit

  • Users checks through clearance/deals/offers when shopping through online.

  • Users find themselves re-visiting websites with free shipping

  • Users looks to purchase trendy styles at a lower cost.

Needs:

  • Users need a way to look into measurements of the garment.

  • Users need to know they can buy discounted items.

  • Users need to know they have free shipping options.

  • Users need to know they can buy trendy styles that are on the cheaper end.


User Persona

User persona was created based on user’s needs, frustrations, motivations, and goals all identified from empathy map.

Storyboard

Illustrated user’s frustration and a solution into 9 square storyboard illustration.


3.Ideate

Goals: To create information architecture and flows

Process: Card sorting, Site map, Task flow, User Flow

Card Sorting

Card sorting method was conducted to help design the initial information architecture of Mirror Site. By Using optimalSort website, rolled out a open card sorting exercise to 6 participants.


Site Map

Created a Site Map for Mirror. Picked out key features of the site and arranged them in a visual format


Task Flow

To understand the process that user goes through when completing a task, a task flow was created. Mirror’s one of the most important feature (buying feature) was chosen to map out the task flow


User Flow

Created a user flow chart by mapping out various point of entry. Each colorway represents different ways a user can complete a task.


4.Design

Goals: To create Mirror’s UI, key wireframes, and branding of Mirror’s website

Process: Sketches, wireframes, logo design, style tile, and UI kit

Sketches

Created 3 potential layout design for Mirror using procreate (ipad). Focused on Image placements, Search, login, and  cart locations to guide and direct users.

Wireframes

Created low-mid fidelity wireframes for Mirror. Early structures of Mirror is presented in these wireframes without any heavy visual elements distracting the designs.

Logo & Style Tile

Sketched variety of ideas/ logo designs for Mirror. Began by writing down the word that is related to the brand and sketched based on some words. then chose couple of ideas that stood out and iterated in sketch app. Created a style tile to show the visual choices made for Mirror. This style tile shows basic color palette, button styles, typeface, and images that will be used for Mirror.

UI Kit

UI kit was created to show and layout visual components that will be used in designing the interface of Mirror.

5. Prototype

Goals: To prototype Mirror’s website to use it for usability testing

Process: Prototype, Usability testing

Responsive UI design

To prepare for user testing clickable prototypes were made. Mid fidelity wireframes were refined to high fidelity mockups before prototyping in Adobe Xd

Task #1wireframes:

Users are prompted to search for blue stripe shirt and proceed with checkout

Clickable Prototype: HERE

Task #2 wireframes:

Users are to look for black military coat and proceed to checkout

Clickable prototype: HERE

Task #3 wireframes:

Users are prompted to look for a discounted dress and proceed to checkout.

Clickable prototype: HERE


6. Iterate

Goals: To iterate the design to improve usability

Process: Affinity Map, Revised Wireframes

Affinity Mapping

Affinity map was created to show a visual presentation of all the data collected/observed while user testing was in process. After success, patterns, and comments have been sorted out, insights were discovered and from there recommendations were prioritized from low to high.

Revised wireframes

clickable prototype: HERE

Mock Up

UI-Design-MASTER3.gif

Redlining


Next step:

  • Refine prototype

  • Create prototype for other key features (ex: size chart & guide)

  • User testing for iterated prototype and new prototypes

Group 61011.png